The Sun Belt Rent Crash Is Real — It's Just Not Houses
There’s a video going around right now with a clean, confident story: high mortgage rates trapped sellers who couldn’t get 2021 prices, so they pulled their listings and rented the houses out instead — and all that “accidental landlord” supply is crashing rents across the Sun Belt.
It’s a good story. The map is even right — the Sun Belt is where the housing adjustment is happening. But the mechanism is wrong, and you can prove it’s wrong with one split the headline version never makes: separate single-family rent from apartment rent. Do that, and the whole “unsold houses are crashing rents” thesis falls apart — while a more interesting story takes its place.
How to read this
Every rent figure below is year-over-year, through the April 2026 data. The accidental-landlord argument is specifically a single-family claim — it’s about houses that didn’t sell becoming rentals. So single-family rent is the number that has to move for the story to be true. It doesn’t. Keep that test in mind as you read: if the mechanism were real, the single-family column would be red.
What single-family rent actually shows
If unsold homes were flooding the rental market, single-family rents would be falling. Across the metros that come up every time this gets discussed, they’re still growing:
- Denver, CO — single-family rent +0.8%
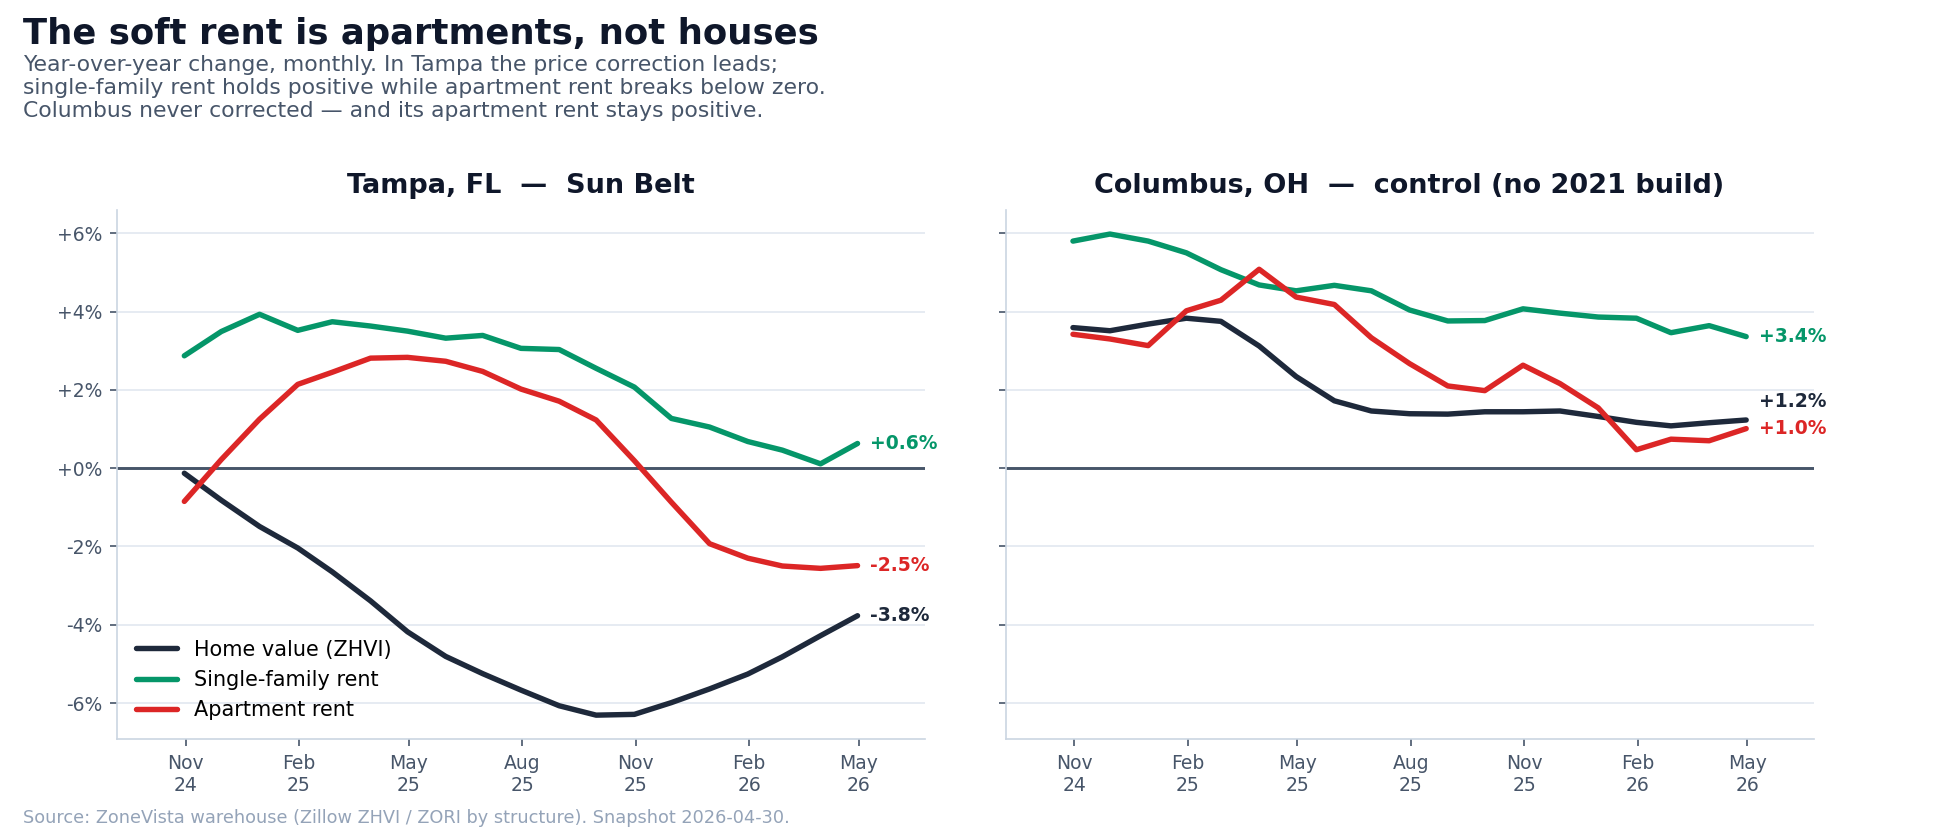
- Tampa, FL — +0.6%
- Phoenix, AZ — +0.6%
- Dallas, TX — +0.5%
- Austin, TX — +0.4%
- Cape Coral, FL — −2.1% — the only negative in the group, and a market with its own insurance-and-climate problem that I’ll come back to
Five of six positive. The thing the accidental-landlord story says should be deep red is, in fact, green. So the softness people are genuinely feeling has to be coming from somewhere else.
The softness is in apartments
It’s multifamily. Same metros, same period:
- Cape Coral, FL — apartment rent −5.4%
- Austin, TX — −3.3%
- Denver, CO — −2.6%
- Tampa, FL — −2.5%
- Phoenix, AZ — −1.9%
- Dallas, TX — −0.8%
That’s the rent decline everyone’s pointing at — and it has nothing to do with houses that didn’t sell. It’s the 2021–2023 apartment construction boom finally delivering units into exactly these markets. And notice the order: Cape Coral and Austin, the two with the heaviest building pipelines, show the deepest declines. Dallas, which kept absorbing units, is barely negative. The drop tracks how much each market overbuilt.
The control that proves it’s the build
Here’s the cleanest part. If this were a national, interest-rate story, it would show up everywhere. It doesn’t. Take two markets that never got the construction wave — same rates, same economy:
- Columbus, OH — apartment rent +1.0%
- Detroit, MI — apartment rent +1.2%
Apartment rent is positive in the markets that didn’t overbuild and negative in the ones that did. The single-family-above-multifamily ordering is normal everywhere — what’s new is the Sun Belt pushing its apartment leg below zero while the Midwest stays above it. The only variable that changed is whether the cranes showed up. The houses aren’t the story. The cranes are.
The bigger event: a price correction that already happened
Even the apartment story is a sideshow to the real one. The actual Sun Belt event is a for-sale price correction that came first and led rents by about a year. In Tampa, home values were already down 4% in spring 2025 while rents were still climbing past +3%. Anyone watching that price chart fall and calling it a rent collapse is reading the lagging signal as the leading one.
And that price correction looks to be bottoming, not accelerating. Tampa home values troughed near −6.3% last fall and have recovered to about −3.8%. Phoenix went from −3.6% to −1.8%. Five of the six Sun Belt metros I looked at are climbing off the floor — which is worth holding in mind against the video’s projection of another 32 to 41% to fall. The two still pinned at the bottom are Austin (around −6%) and Denver (around −3%), which happen to be the two heaviest tech-driven 2021 run-ups. The correction isn’t ahead of these markets. For most of them it’s behind.
What to actually take from this
For an investor underwriting a Sun Belt deal: don’t price in a single-family rent collapse the data says isn’t happening. Do respect that new apartment supply nearby can sit on your rents for a while if you’re in or near multifamily — and that in most of these metros the for-sale price reset has likely already occurred.
A few honest caveats. Apartment rents are lower in dollar terms than single-family ($1,400–1,800 versus $2,000–3,000 in these markets), so a 2.5% multifamily decline is a smaller dollar move than the percentage suggests — the event is the sign turning negative in the overbuilt markets, not the size of the number. Cape Coral is the one metro that partly fits the original “rage delisting” picture: single-family rent actually negative, values down 8%, listings down sharply — but it’s a climate-and-insurance outlier, not a template for the region. And all of this is a single snapshot; it’s a read on where things stand, not a forecast.
The Sun Belt is adjusting. It’s just adjusting in apartments and in prices — not in the single-family rents the story was built on.