Inside a Metro, Rental Yield Is a Price Story — Not a Rent Story
A while back I showed that most of the variation in rental yield doesn’t sit between metros — it sits inside them. Pool every ZIP with both a home-value and a rent index, and roughly two-thirds of the spread in gross yield is within-metro dispersion; only about a third is the gap between metros. Morgan Weiss asked the follow-up that stuck with me: okay — but why? When one ZIP prints a 7% gross yield and the ZIP next door prints 4%, what is actually different about it?
There are only two candidates. Yield is annual rent over home value. A ZIP can out-yield its neighbor because its rents run strong for the metro (numerator), or because its home values run cheap (denominator). So I decomposed it against a fresh May-2026 warehouse snapshot.
The baseline still holds
Across 8,346 ZIPs in 155 metros (≥10 scored ZIPs each), within-metro yield variance came back at 67.2%, between-metro at 32.8% — a 2.05-to-1 split, the same ~2:1 on current data. At a ≥20-ZIP floor within-share rises to 70.7%. Median gross yield is 5.59% (10th–90th: 3.5%–8.7%).
The decomposition: it’s the denominator
In logs, ln(yield) = ln(annual rent) − ln(home value), so the within-metro
variance partitions into a rent-numerator share and a value-denominator share that
sum to exactly 100% (reconstruction exact to the third decimal):
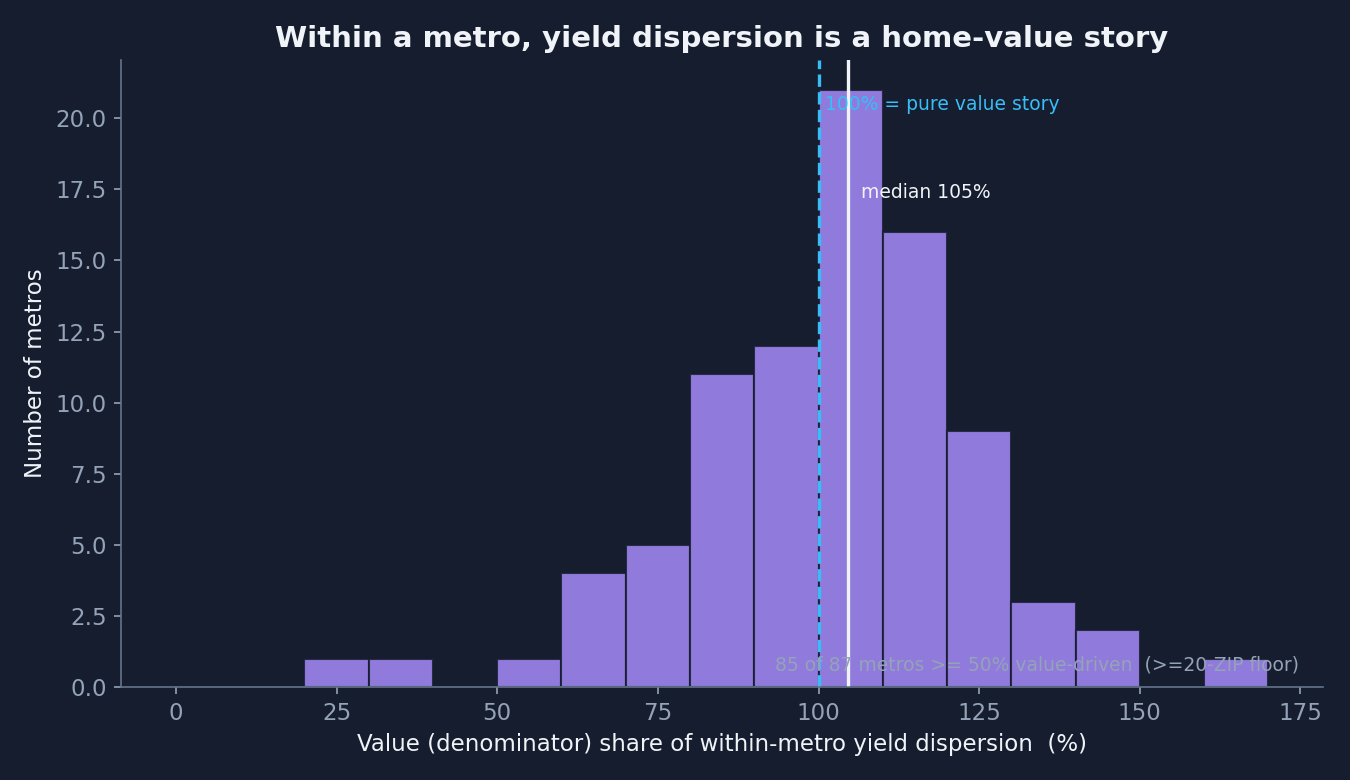
- Value (denominator) share: 102%
- Rent (numerator) share: −2%
Essentially all of it is a home-value story; the rent numerator is slightly negative (pricier ZIPs carry higher rents, which partly offsets the yield spread their prices create). Within a metro, a high-yield ZIP is high-yield because the houses are cheap, not because the rents are strong.
What it looks like on the ground: Memphis
Memphis is one of the more value-driven metros — 142% of its internal yield spread is the home-value denominator. Two of its ZIPs make it concrete. In ZIP 38106, the typical home is worth about $58,500 against roughly $11,100 of annual market rent — a 19.0% gross yield. In ZIP 38120, the typical home runs about $427,600 against roughly $16,800 of annual rent — a 3.9% yield. Same metro, same rental market: home values differ more than sevenfold, annual rents barely 1.5x. The five-fold yield gap is almost entirely the price gap. Memphis’s median ZIP sits between them at 7.6% on a ~$252,000 home.
Not one metro, and not a fluke
Metro by metro across the 87 metros with ≥20 scored ZIPs, 85 of 87 are value-driven (median value share 105%, zero thin-print flags). It holds in cheap and expensive markets alike — Jacksonville at 134%, and even Boston (162 ZIPs, yields compressed into a 3.1%–5.6% band) at 128%. Two metros genuinely invert, and they’re worth naming for honesty: New York-Newark-Jersey City (447 ZIPs) is a rent story (value share 39%), and Cape Coral-Fort Myers is more so (21%). A strong central tendency with real exceptions — not a universal law.
Durable, not a snapshot
On a balanced panel — the same 3,419 ZIPs, same 51 metros, each May from 2023 to 2026 — the within-metro share ran:
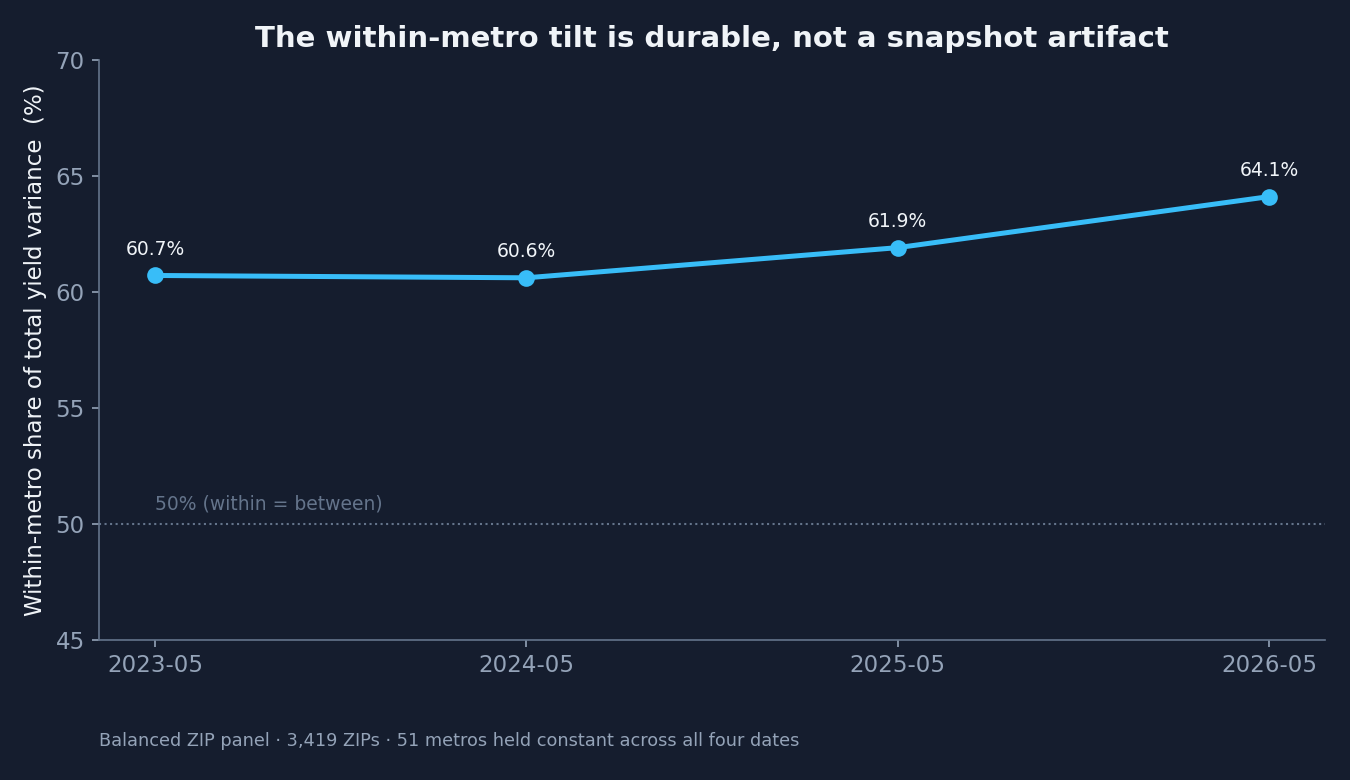
60.7% → 60.6% → 61.9% → 64.1%. Never below 60%, drifting up through the cooling — a stable structural feature, not a one-month artifact.
What it means for capital
When a ZIP jumps out on a yield screen inside an ordinary metro — a Memphis 38106 against a 38120 — the odds are overwhelming you’re looking at a cheap-basis ZIP, not a strong-rent one. That’s not disqualifying, but it moves the diligence: a yield built on strong rents is a demand signal; a yield built on a cheap price is a signal about why the house is cheap, which the yield number can’t answer. To be clear, this is a decomposition of housing-market structure — price versus rent — not a recommendation to buy 38106 or avoid 38120, and it says nothing about the people who live in either. A low price is a market fact that raises a question, not an answer, and not a prediction about any tenant.
Limits, up front
Gross yield from two observed Zillow legs. Only about a third of ZIPs carry a usable rent index (skewed to denser areas — a floor, not a census). The denominator is price, not the full demand story (household formation, vacancy, absorption aren’t in the warehouse yet). All trailing to May 2026; nothing forecasts. Within those limits the finding reconciles against the underlying fact tables exactly and holds across three years: inside a metro, yield dispersion is a price story.